I am a tidyverse enthusiast. The proof is in the pudding: of my six packages on GitHub, only one DESCRIPTION
contains a non-tidyverse package (rcicero, tidyjson). I once contemplated rewriting these packages sans the tidyverse–for science, learning, growth,
bragging rights, and character building–but I broke into a cold sweat once I typed plot. Admittedly, my reliance
on the tidyverse might be considered a crutch. Do I really know R, or just the conventions of a popular subset? A different question
for a different time.
The inspiration for this post was to practice some UNIX command line magic before bringing the data into R. I recently worked through Sean Kross’ excellent Coursera course, The Unix Workbench, and wanted to groove a little in the terminal. My question was this: which tidyverse packages do I use the most?
First, I had to grep for all the tidyverse exports (e.g. “dplyr::”, “purrr::”). Towards that end, I wrote a
small bash script that loops through an input, searching for each item within the package R/ directories, and then counts
the output lines.
#!/usr/bin/env bash
for package in $@
do
        grep $package $(find . -name "*.R") | wc -l
done
I named the script count_namespace_exports.sh, granted the execution permission, called the script with the tidyverse packages,
and piped the output into a file.
chmod +x count_namespace_exports.sh
./count_namespace_exports.sh "dplyr::" "purrr::" "tidyr::" "httr::" "tibble::" "stringr::" "readr::" "xml2::" "rvest::" "jsonlite::" > package_exports.txt
echo "dplyr::" "purrr::" "tidyr::" "httr::" "tibble::" "stringr::" "readr::" "xml2::" "rvest::" "jsonlite::" > packages.txt
Now to read the data into R for cleaning and visualization.
library(tidyverse)
packages <- readLines("packages.txt") %>%
  stringr::str_replace_all("::", "") %>%
  stringr::str_split(" ") %>%
  .[[1]]
package_uses <- parse_number(readLines("package_exports.txt"))
package_df <- tibble(packages, package_uses)

ggplot(package_df, aes(reorder(packages, package_uses), package_uses)) +
  geom_bar(stat = "identity") +
  labs(x = "",
       y = "Occurences",
       title = "I am a tidyverse Enthusiast") +
  coord_flip() +
  theme_minimal()
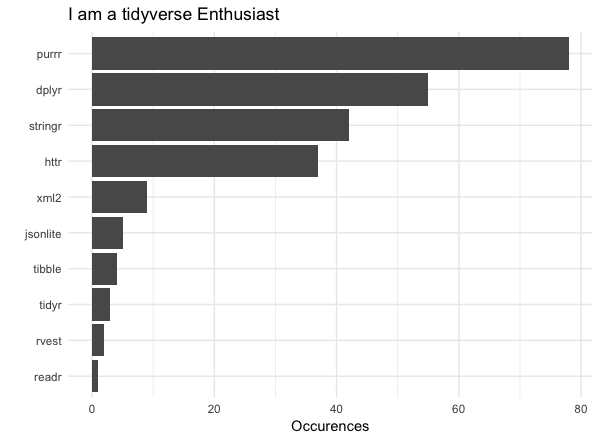
Was surprised to see that purrr overtook dplyr. Now to ascertain from Terminal which functions I use most.