This may surprise you, but there isn’t an easy, “canonical” method to construct simple probability trees in R. Google uncovers some hacky attempts from years past, but it obviously hasn’t been a pressing issue or priority in the community. The reason for this, I think, is threefold: (1) probability trees are boring, STATS101 material; (2) until recently, there haven’t been great tools to render nodes and trees; and (3) designating a sensible, comprehensive input is somewhat tricky. What do you name the parameters? Should the function(s) take a table or data frame? If so, in what shape?
To expand on the first point, R and the R community are great at introducing programming techniques to people who know statistics, but less great at introducting statistics to people who know how to program. The purpose of this post is to demonstrate how a simple statistical procedure–Bayes’ Theorum–might be calculated and displayed in a simple visual format in R.
As I alluded to above, there are now several great tools to render networks, trees, and other such hierarchies. After considering
data.tree and igraph, I decided the Diagrammer package best suited my needs. The documentation can be found here.
Note: these trees required the development version of DiagrammeR, so you may need to devtools::install_github("rich-iannone/DiagrammeR")
for the code to work.
My bayes_probability_tree function is below. The assumed context is a medical test: What is the probability I have X, given
that I test positive?
library(DiagrammeR)

bayes_probability_tree <- function(prior, true_positive, true_negative) {

  if (!all(c(prior, true_positive, true_negative) > 0) && !all(c(prior, true_positive, true_negative) < 1)) {
    stop("probabilities must be greater than 0 and less than 1.",
         call. = FALSE)
  }
  c_prior <- 1 - prior
  c_tp <- 1 - true_positive
  c_tn <- 1 - true_negative

  round4 <- purrr::partial(round, digits = 4)

  b1 <- round4(prior * true_positive)
  b2 <- round4(prior * c_tp)
  b3 <- round4(c_prior * c_tn)
  b4 <- round4(c_prior * true_negative)

  bp <-  round4(b1/(b1 + b3))

  labs <- c("X", prior, c_prior, true_positive, c_tp, true_negative, c_tn, b1, b2, b4, b3)

  tree <-
    create_graph() %>%
    add_n_nodes(
      n = 11,
      type = "path",
      label = labs,
      node_aes = node_aes(
        shape = "circle",
        height = 1,
        width = 1,
        x = c(0, 3, 3, 6, 6, 6, 6, 8, 8, 8, 8),
        y = c(0, 2, -2, 3, 1, -3, -1, 3, 1, -3, -1))) %>%
    add_edge(
      from = 1,
      to = 2,
      edge_aes = edge_aes(
        label = "Prior"
      )
    ) %>%
    add_edge(
      from = 1,
      to = 3,
      edge_aes = edge_aes(
        label = "Complimentary Prior"
      )
    ) %>%
    add_edge(
      from = 2,
      to = 4,
      edge_aes = edge_aes(
        label = "True Positive"
      )
    ) %>%
    add_edge(
      from = 2,
      to = 5,
      edge_aes = edge_aes(
        label = "False Negative"
      )
    ) %>%
    add_edge(
      from = 3,
      to = 7,
      edge_aes = edge_aes(
        label = "False Positive"
      )
    ) %>%
    add_edge(
      from = 3,
      to = 6,
      edge_aes = edge_aes(
        label = "True Negative"
      )
    ) %>%
    add_edge(
      from = 4,
      to = 8,
      edge_aes = edge_aes(
        label = "="
      )
    ) %>%
    add_edge(
      from = 5,
      to = 9,
      edge_aes = edge_aes(
        label = "="
      )
    ) %>%
    add_edge(
      from = 7,
      to = 11,
      edge_aes = edge_aes(
        label = "="
      )
    ) %>%
    add_edge(
      from = 6,
      to = 10,
      edge_aes = edge_aes(
        label = "="
      )
    )
  message(glue::glue("The probability of having (prior) after testing positive is {bp}"))
  print(render_graph(tree))
  invisible(tree)
}
The function renders the tree and returns it invisibly for further edits. For example, let’s set our prior at 0.07, the sensitivity of the test (true positive) at 0.95, and the specificity of the test (true negative) at 0.98.
> bayes_probability_tree(prior = 0.07, true_positive = 0.95, true_negative = 0.98)
The probability of having (prior) after testing positive is 0.7814
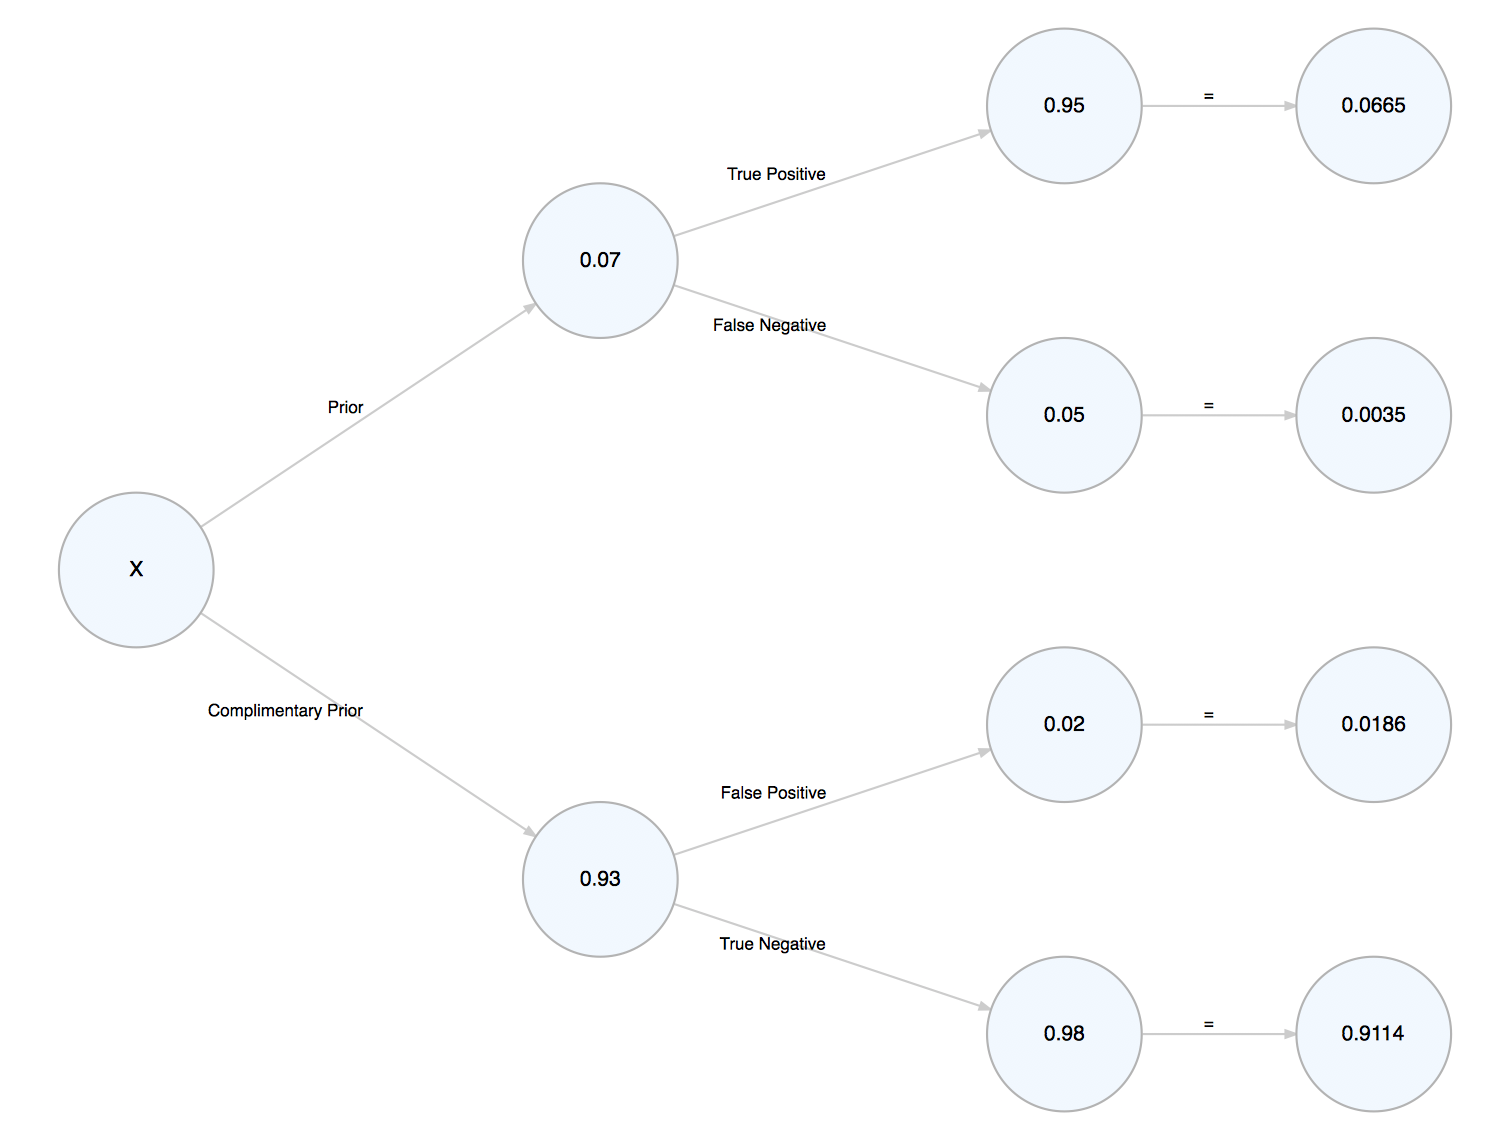
The message produced follows Bayes Theorum: the probability of A, given B, is the probability of A and B divided by the probability of B. Thus, there is a 78% chance that someone has X, given that they tested positive.
I’m not sure how or if these simple statistical tasks could be expanded into a package, but I think it’s worth considering.