class: center, middle, inverse, title-slide # Building R Packages ## Lessons Learned and Recommendations ### David Ranzolin ### November 7, 2019 --- # About Me .pull-left[ - Senior Analyst at SFSU - R Partisan - D3.js Dilettante ] .pull-right[ - GIS Enthusiast - Crazy Cat Lady - Washed-up Point Guard ] <div id="htmlwidget-a57277d6f55547b9f63b" style="width:100%;height:432px;" class="leaflet html-widget"></div> <script type="application/json" data-for="htmlwidget-a57277d6f55547b9f63b">{"x":{"options":{"crs":{"crsClass":"L.CRS.EPSG3857","code":null,"proj4def":null,"projectedBounds":null,"options":{}}},"calls":[{"method":"addTiles","args":["//{s}.tile.openstreetmap.org/{z}/{x}/{y}.png",null,null,{"minZoom":0,"maxZoom":18,"tileSize":256,"subdomains":"abc","errorTileUrl":"","tms":false,"noWrap":false,"zoomOffset":0,"zoomReverse":false,"opacity":1,"zIndex":1,"detectRetina":false,"attribution":"© <a href=\"http://openstreetmap.org\">OpenStreetMap<\/a> contributors, <a href=\"http://creativecommons.org/licenses/by-sa/2.0/\">CC-BY-SA<\/a>"}]},{"method":"addMarkers","args":[[37.72,36.6149],[-122.476,-121.8221],null,null,null,{"maxWidth":300,"minWidth":50,"autoPan":true,"keepInView":false,"closeButton":true,"className":"presentation-popup"},["<b><a href='https://www.sfsu.edu/'><pre> San Francisco State <\/pre><\/a><\/b><br/><img src='images/intro_pic.jpg'>","<b><a href='https://www.sfsu.edu/'><pre> CAIR 2019 <\/pre><\/a><\/b><br/><img src='images/crowd.jpg'>"],null,null,null,null,{"interactive":false,"permanent":false,"direction":"auto","opacity":1,"offset":[0,0],"textsize":"10px","textOnly":false,"className":"","sticky":true},null]}],"setView":[[37.95,-122.4799],9,[]],"limits":{"lat":[36.6149,37.72],"lng":[-122.476,-121.8221]}},"evals":[],"jsHooks":[]}</script> --- # Today's Presentation .pull-left[ * R packages * Why build one? * Anatomy * `rsfsu` usage * Code * Rmd templates * Project template * What do you need to know? * Recommendations * Resources * Questions? ] .pull-right[  ] --- # What is an R Package? > *A package bundles together code, data, documentation, and tests, and is easy to share with others. The huge variety of packages is one of the reasons that R is so successful: **the chances are that someone has already solved a problem that you’re working on, and you can benefit from their work by downloading their package**.* <div style="text-align: right;"> -Hadley Wickham in <i>R Packages</i> </div> <img src="Presentation_Slides_files/figure-html/unnamed-chunk-2-1.png" style="display: block; margin: auto;" /> --- # Benefits of Building R Packages * Save time! * Perform complex calculations * Reduce clicks * Shortcuts to insight * Collaboration * Apply styles and branding * Organize your project files <img src="images/pipeline.png" width="75%" height="300" align="middle"> --- # Your IR Context: Where does R fit in? > *Anything that can be automated, should be automated* .pull-left[ #### Consider your 'data pipeline': * Where is the most time spent? * Extraction and cleaning? * Visualization and analysis? * Design and formatting? * How many applications? * RDBMS? * SPSS/SAS/Stata? * Excel? * Tableau/WebFocus/Power BI? * Adobe Illustrator? * Powerpoint? * $? ] .pull-right[  ] --- # Package Anatomy: Tour of {rsfsu} [The rsfsu GitHub repository](https://github.com/ir-sfsu/rsfsu) 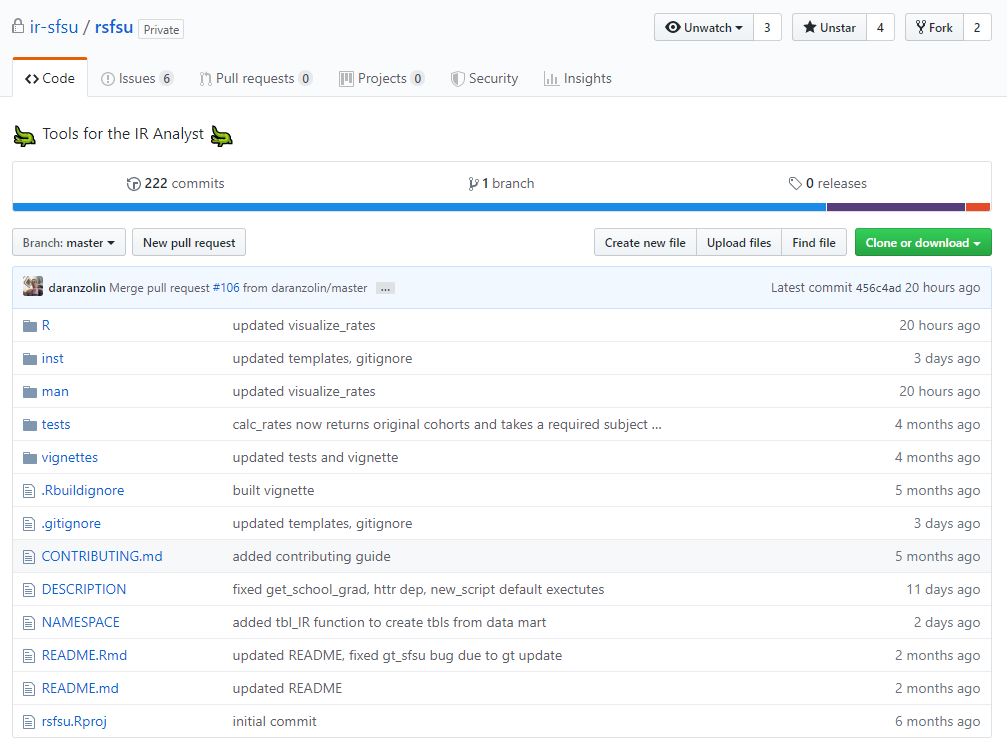 --- # Getting Data 1: The Data Warehouse ```r library(rsfsu) # Use SQL library(DBI) con <- connect_to_datamart() sql <- "SELECT STU_LEVEL_DESC1, AVG(TERM_GPA) AS avg_term_gpa FROM IRDMSTG.DM_ENR WHERE FULL_PART LIKE 'Full%' AND STU_LEVEL_DESC3 LIKE '%Undergrad%' GROUP BY STU_LEVEL_DESC1" res <- dbGetQuery(con, sql) # Use dplyr library(dplyr) res <- tbl_IR("DM_ENR") %>% filter(FULL_PART == "Full-time", STU_LEVEL_DESC3 %like% "%Undergrad%") %>% group_by(STU_LEVEL_DESC1) %>% summarize(avg_term_gpa = mean(TERM_GPA, na.rm = TRUE)) ``` --- # Getting Data 2: ERS Files ```r # Fall 18 ERSS f18 <- get_erss('184') # Fall 13 ERSA f13a <- get_ersa('134', replace_labels = FALSE) # 2007 ERSG g07 <- get_ersg('07') # Get last 3 years of ersg ersg1518 <- purrr::map_dfr(15:18, get_ersg) ``` --- # Getting Data 3: DoE / CSU / Box / Etc ```r # Data from CA DoE: https://www.cde.ca.gov/ds/ enr1718 <- get_school_enr_data(year = '2017-18') susp <- get_school_discipline_data(year = '1718',category = 'susp') ucgrads <- get_school_grad_data('2016-17', 'UCGradEth') # CSU Open Data inst <- get_csu_open_data("Institution of Origin All Data") hegis <- get_csu_open_data("Hegis CIP Crossover") # Box files library(boxr) eop <- box_read_excel(box_search("EOP Students")) # Shortcuts to file server cc <- campus_climate_tidy() ca_counties_shp <- file.path(ir_data(), "Shapefiles/ca_counties") ca_counties <- sf::st_read(ca_counties_shp) ``` --- # Analyzing Data 1: Grad/Retention Rates ```r # Calc grad rates by cohort, sex grad_rates <- calc_rates(tbl_IR("DM_RETN_SID"), cohort_year = "20124", years_out = 6, subject = "graduation", COHORT_TYPE_DESC1, SEX) visualize_rates(grad_rates) ``` 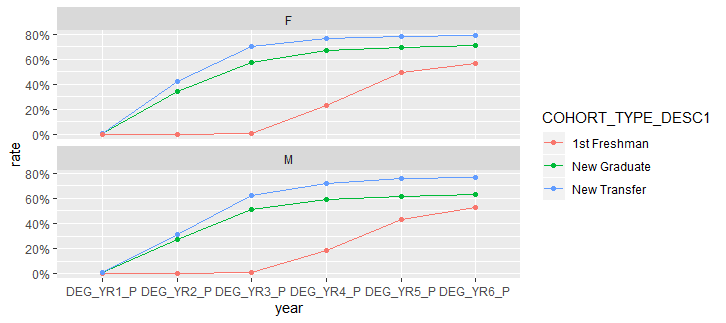 --- # Analyzing Data 2: Time-to-Degree ```r # Calculate time-to-degree by cohort, college calc_ttd(grad_years = "2017-18", ADM_BASE_DESC2, COLLEGE_LONG) ``` ``` # A tibble: 19 x 4 ADM_BASE_DESC2 COLLEGE_LONG students avg_ttd <chr> <chr> <int> <dbl> 1 1.Freshman Starter "Business " 608 4.85 2 1.Freshman Starter "Education " 27 4.03 3 1.Freshman Starter "Ethnic Studies " 25 4.95 4 1.Freshman Starter "Health and Social Sci " 539 4.53 ``` --- # Analyzing Data 3: Grade Distributions ```r # Visualize grade distribution for all 'GWAR' classes tbl_IR("DM_CRS_EOT") %>% filter(CRS_SUFFIX %like% "GW%") %>% grade_dist() ``` 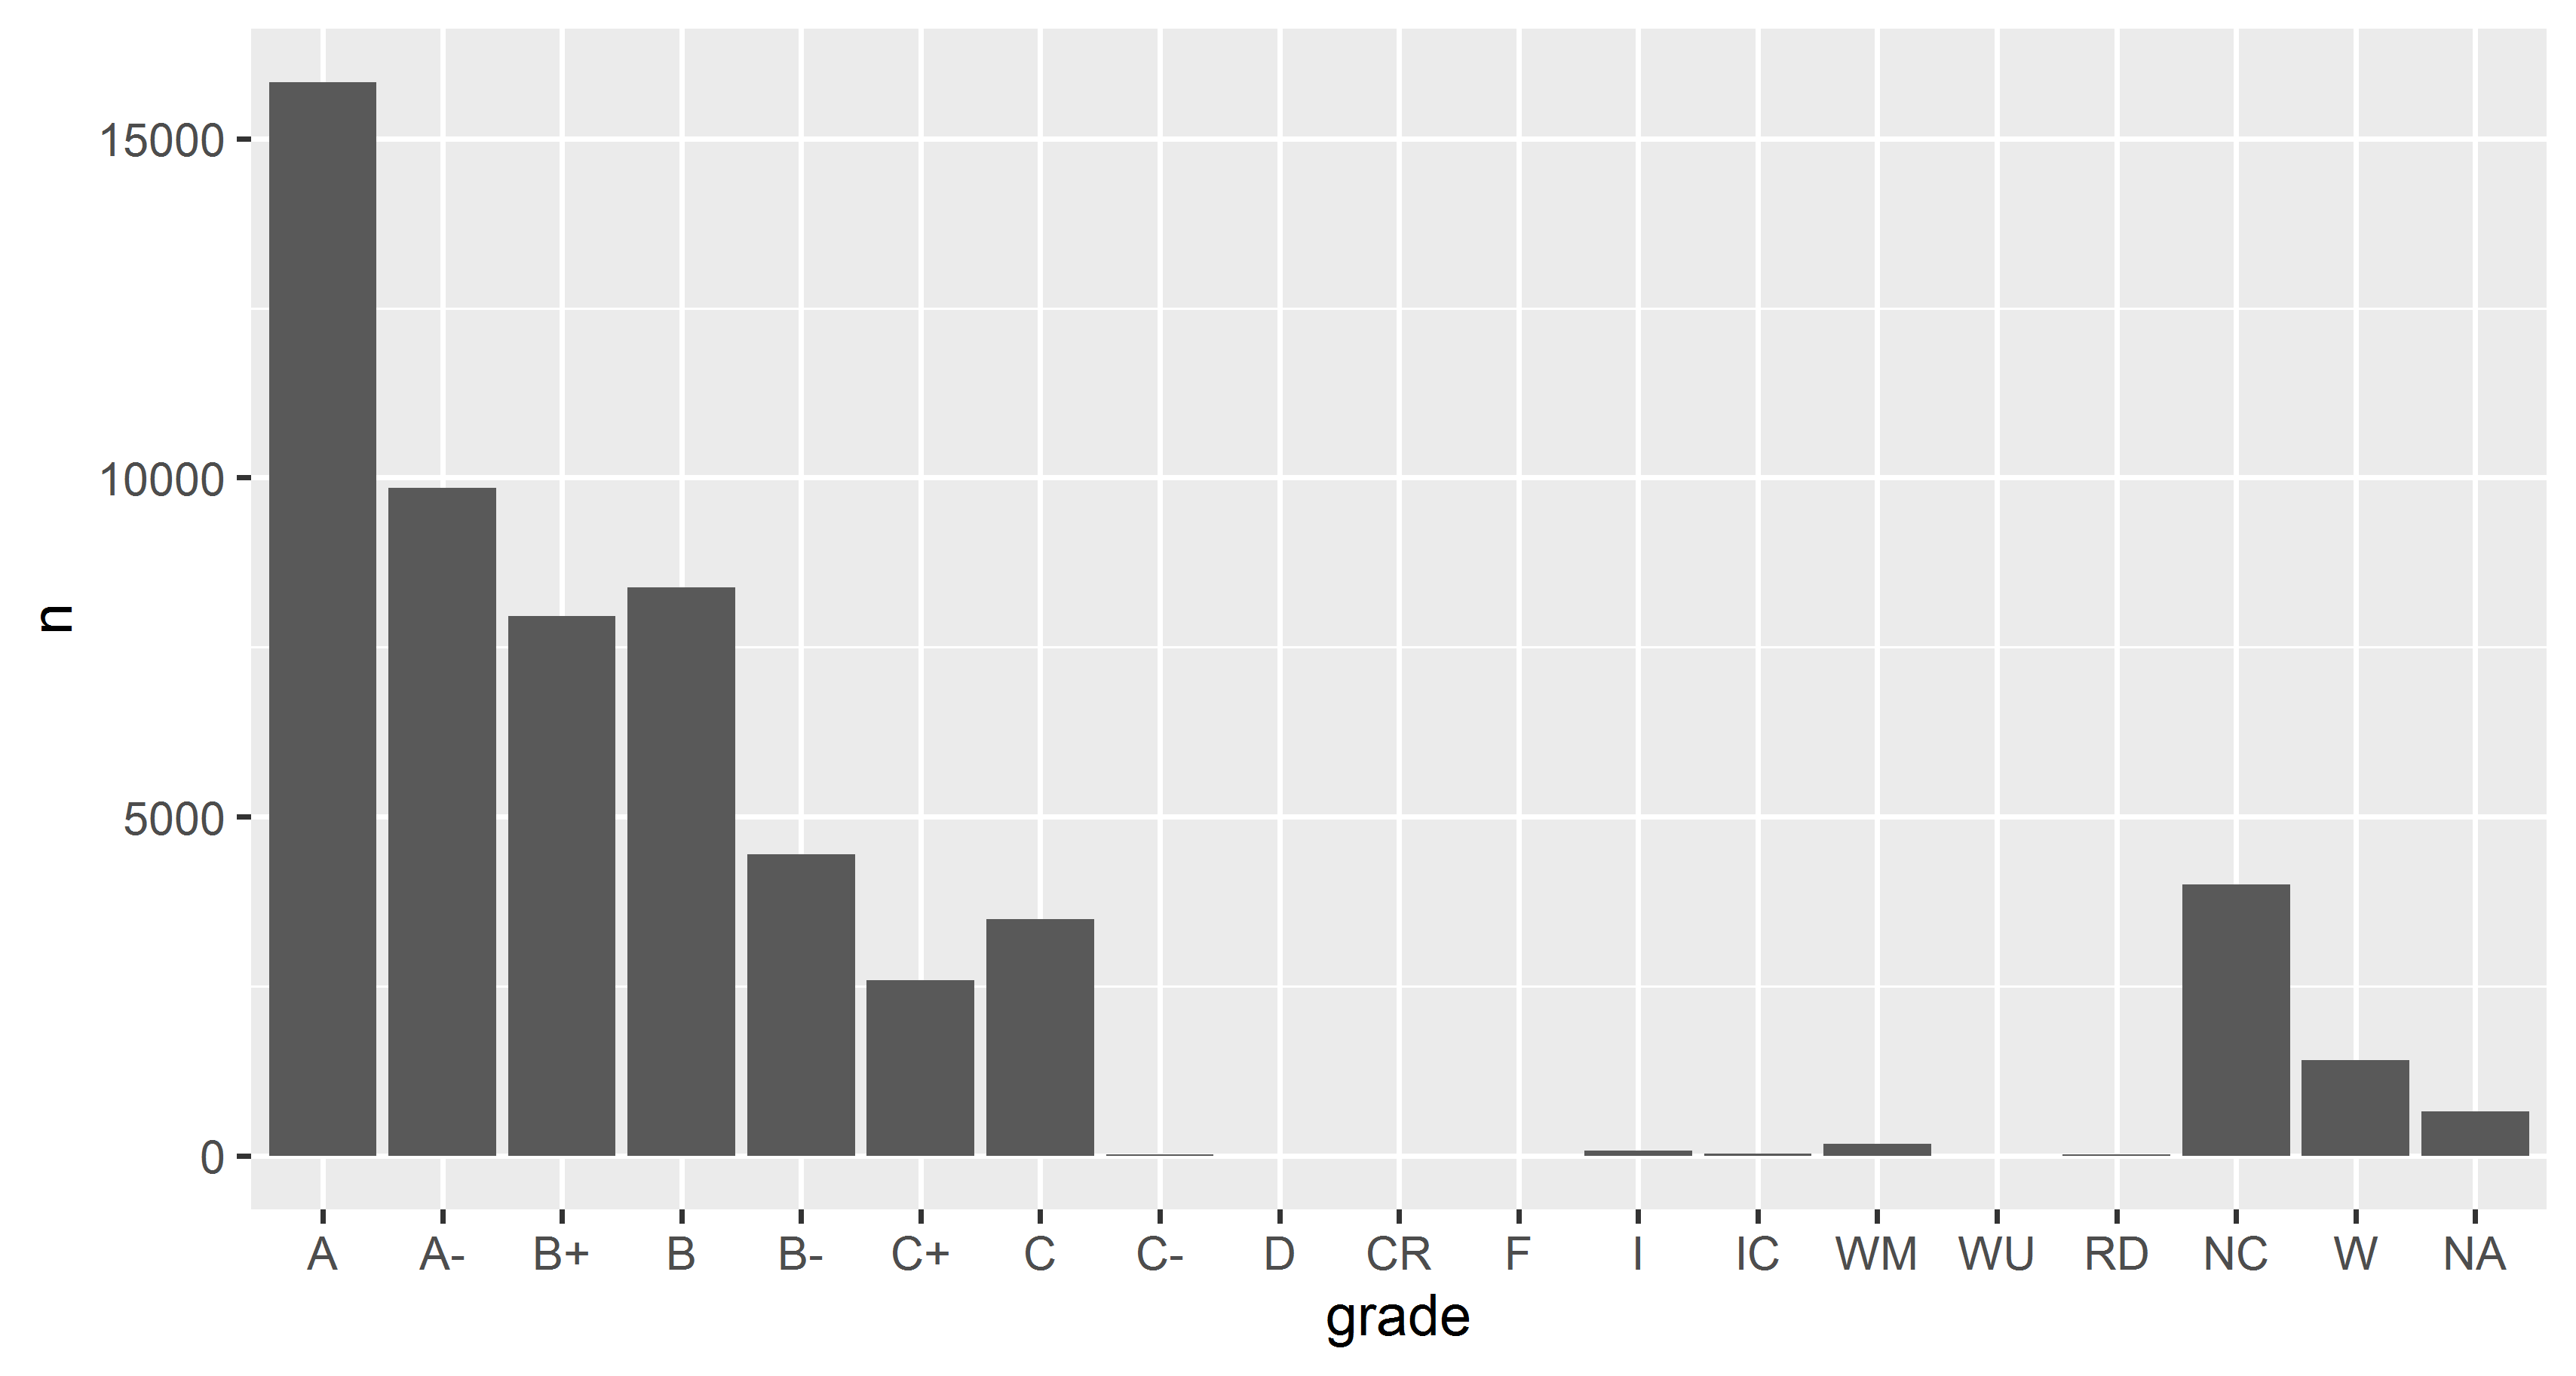 --- # Reporting Data 1: Plot Theme 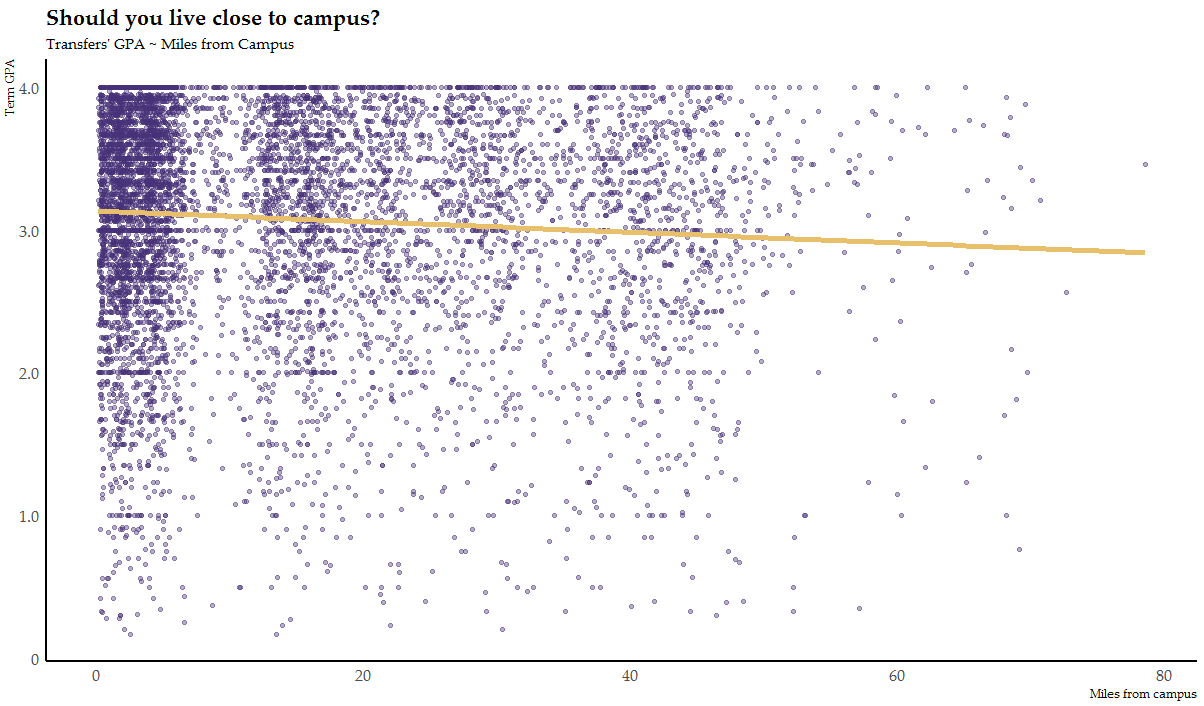 --- # Reporting Data 2: Table Theme ```r transfers %>% group_by(college) %>% summarize(`Miles from Campus (Median)` = round(median(mfc), 1), Students = n()) %>% arrange(desc(`Miles from Campus (Median)`)) %>% gt_sfsu(rowname_col = "college") ``` 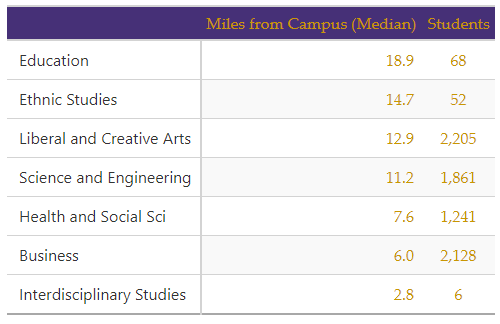 --- # Reporting Data 3: Reports as Functions ```r generate_report("4th-week-summary", "Spring 2019 4th Week Summary.html", list(term = "20192")) generate_report("campus_climate", "English Dept CC Overview.html", list(majors = "English", min_threshold = 20)) library(purrr) terms <- paste0(2010:2018, 4) out_files <- paste(terms, "report.html", sep = "-") params <- map(terms, ~list(term = .x)) walk2( out_files, params, ~generate_report("4th-Week-Summary", .x, .y) ) ``` --- # Shiny Gadgets 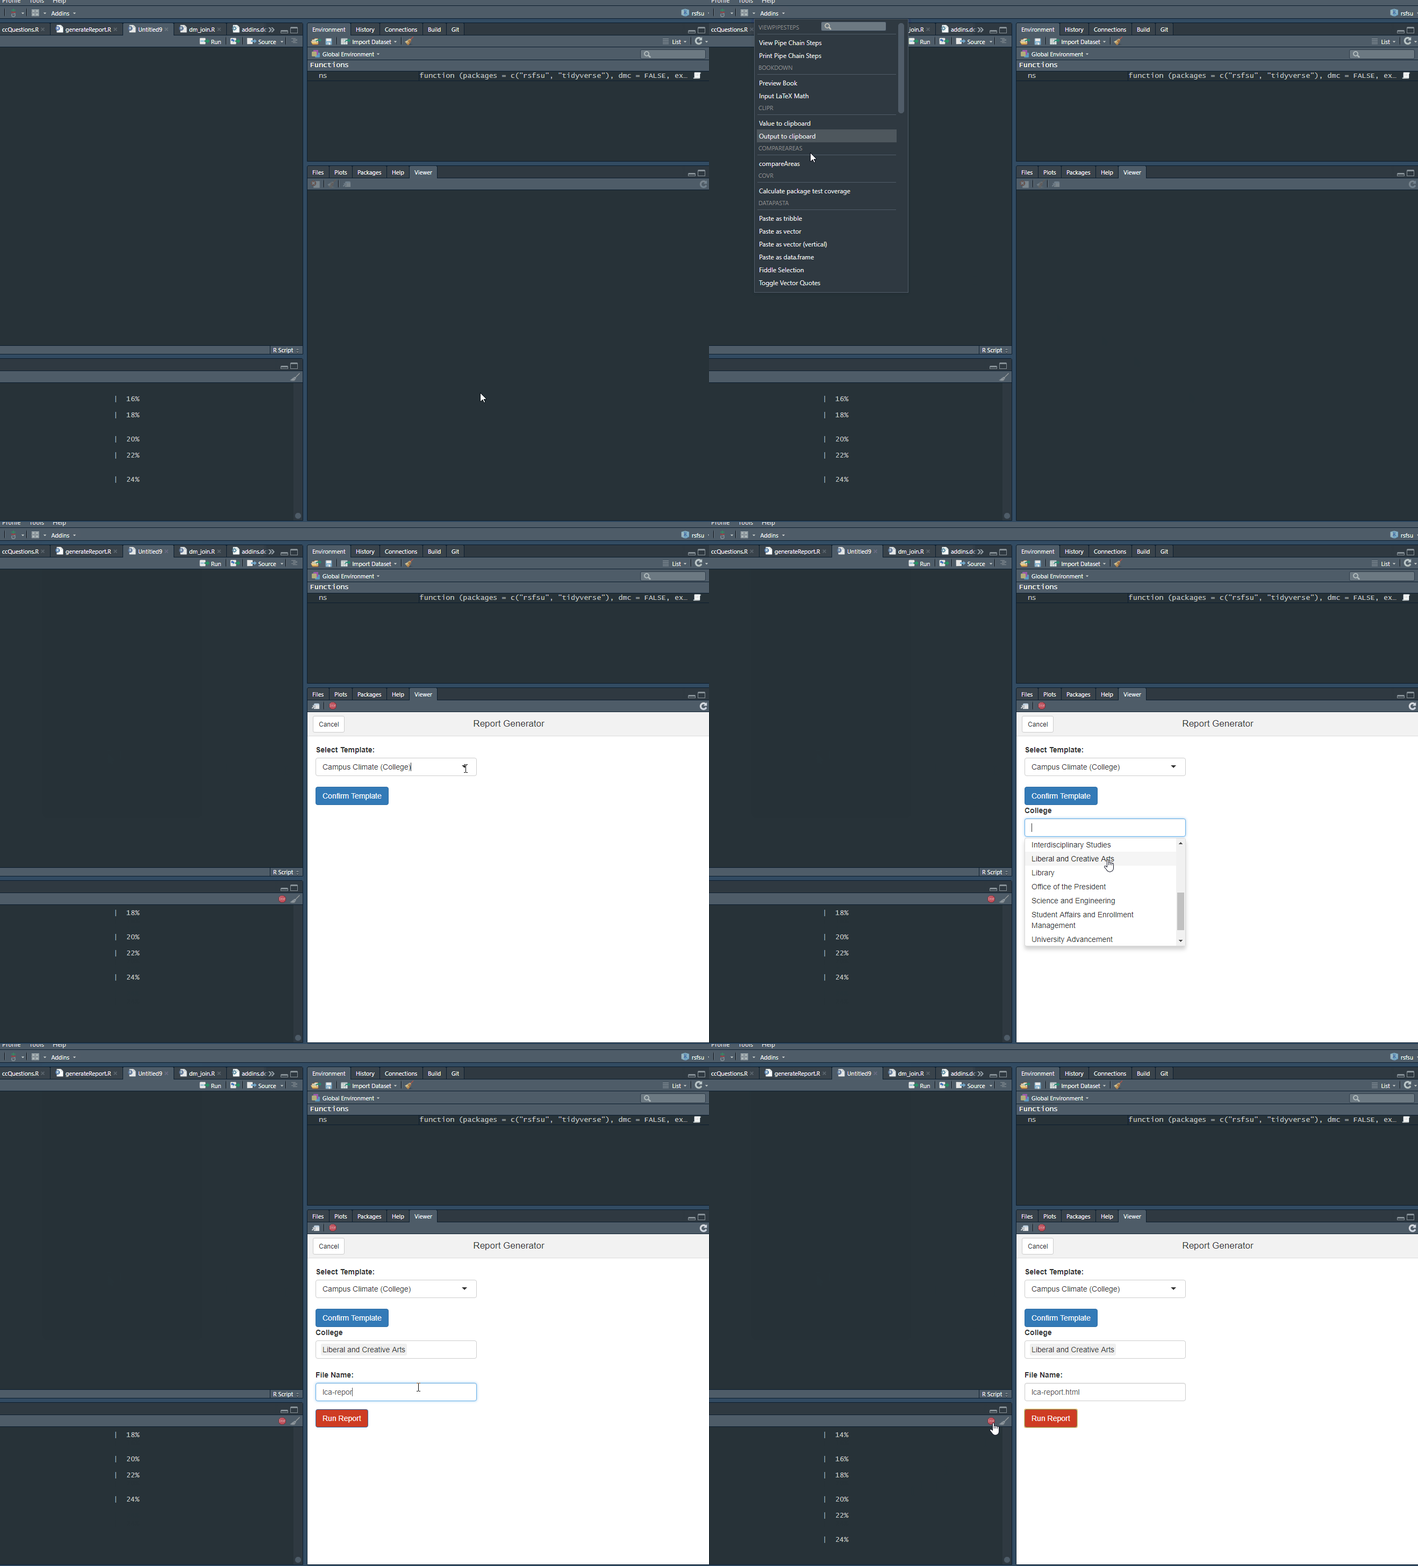 --- # Other Helpers ```r sfsu_colors() ``` ``` dark purple purple dark gold gold blue light green "#231161" "#463077" "#C99700" "#E8BF6A" "#004F71" "#A8AD00" salmon red grey "#B04A5A" "#9A3324" "#53565A" ``` ```r seq_terms(20144, 20192) ``` ``` [1] "20144" "20152" "20154" "20162" "20164" "20172" "20174" "20182" [9] "20184" "20192" ``` * `reformat_terms`: convert SIS terms to academic years (“2123” -> “2011-12”) * `clean_cols`: remove ordering prefixes (“2. Freshmen Starters” -> “Freshmen Starters”) * `dm_join`: join two tables from different sources * `conv_id`: convert between SID, EIN, and SSN * `nice_term`: convert coded term ("20144" -> "Fall 2014") * `percent_labels`: convert decimals to percentage labels (0.643 -> 64%) --- # Templates ### Back to GitHub... --- # What do you need to know? 1. Some R (not a ton!) * If you can write a function you can make a package 2. Some git (very little!) * `git init` * `git status` * `git add` * `git commit` * `git push` * `git pull` * `git clone` --- # Recommendations * Don't re-invent the wheel * Learn about your data * Learn from your coworkers * Learn about your office's history * Break problems into smaller problems. * Could a function do that? * Could I turn this into a template? * Use git for version control * Use the devtools and usethis packages * Learn a little HTML/CSS --- # Resources 1. *R Packages* by Hadley Wickham (Free online!) 2. The usethis package * `create_package` * `use_readme_rmd` * `use_testthat` * `use_github` 3. The devtools package * `document` * `test` * `roxygen` * `install` 4. Twitter 5. The RStudio Community --- # Thank you! Some of my other packages: - **[ViewPipeSteps](https://github.com/daranzolin/ViewPipeSteps)** - Generate View() tabs for each step in a pipe chain. - **[rcanvas](https://github.com/daranzolin/rcanvas)** - R client for the Canvas LMS. Get data, copy courses, grade students, manage your online classroom, etc. - **[d3rain](https://github.com/daranzolin/d3rain)** - 'Raindrop' visualizations in R with d3.js. - **[inferregex](https://github.com/daranzolin/inferregex)** - Infer the regular expression of a string. #### Connect with me on... * [Twitter: @daranzolin](https://twitter.com/daranzolin) * [LinkedIn: dranzolin](https://linkedin.com/in/dranzolin/) * [GitHub: daranzolin](https://github.com/daranzolin) * [Blog: daranzolin.github.io](https://daranzolin.github.io/) * Email: daranzolin@sfsu.edu --- # Photo Cred - [Allison Horst](https://github.com/allisonhorst/stats-illustrations) - [cashcats.biz](https://cashcats.biz/)