Earlier today I completed my first (sprint) triathlon. For me, it was 2 hours and 12 minutes of barbarism–a 1/2 mile swim, a 15 mile bike ride, and a three mile run to boot. I knew my time was poor; I struggled to wiggle out of my wet suit, was passed by over 100 people while cycling,1 heard the winner announced before I even started running, and completed the race amongst septuagenarians. But how poor? I needed data.
TBF Racing did not disappoint–within hours the results were online. A few lines of web scraping later, and the data was mine:
library(rvest)
library(magrittr)
library(tidyverse)
library(chron)
url <- "http://totalbodyfitness.com/site/results/2017-golden-state-triathlon-sprint/"
tri <- url %>%
  read_html() %>%
  html_nodes(".raceSchedule") %>%
  html_table() %>%
  .[[1]]

h1 <- names(tri)
h2 <- unlist(tri[1,])
h2[is.na(h2)] <- ""
header <- c()
for (i in seq_along(h2)) {
  if (h2[i] != "") {
    header[i] <- paste(h1[i], h2[i], collapse = " ")
  } else {
    header[i] <- h1[i]
  }
}
tri <- tri[-1,]
names(tri) <- header

convert_mins <- function(x) {
  ch <- times(x)
  60 * hours(ch) + minutes(ch)
}
tri %<>%
  mutate_at(vars(contains("Time")), convert_mins) %>%
  janitor::clean_names() %>%
  mutate(end_swim_mins = swim_time,
         end_bike_mins = swim_time + t1_bike_t2_time,
         end_bike_rank = dense_rank(end_bike_mins),
         start_mins = 0)
I then converted the times to minutes and created some cumulative end_*_mins variables.
A glance at the data:
| rank | bib | name | age | gender | swim_time | swim_rank | t1_bike_t2_time | t1_bike_t2_rank | run_time | run_rank | finish_time |
|---|---|---|---|---|---|---|---|---|---|---|---|
| 1 | 324 | Peter Mendes | 43 | M | 14 | 4 | 41 | 1 | 18 | 2 | 74 |
| 2 | 142 | Travis Lantz | 36 | M | 12 | 1 | 42 | 3 | 19 | 8 | 75 |
| 3 | 134 | Jeremy Dylan Kalmus | 28 | M | 13 | 3 | 43 | 5 | 18 | 3 | 75 |
| 4 | 278 | Greg Watkins | 54 | M | 14 | 5 | 43 | 4 | 20 | 11 | 78 |
| 5 | 121 | Cristobal Heitmann | 31 | M | 15 | 16 | 44 | 8 | 19 | 6 | 79 |
| 6 | 310 | Brian Leighton | 56 | M | 14 | 9 | 42 | 2 | 22 | 36 | 80 |
Now, some questions:
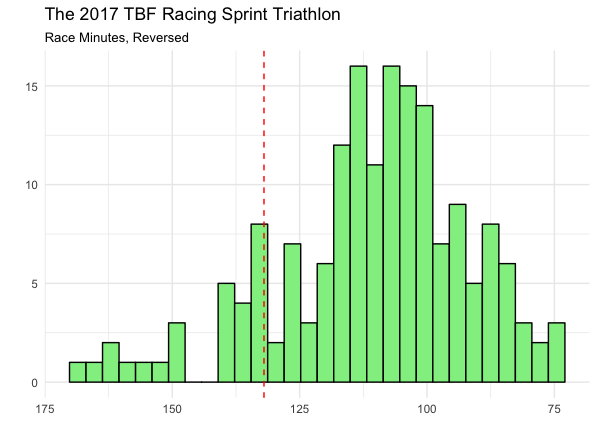
What percentile was my time? (132 minutes)
> round(pnorm(132, mean = mean(tri$minutes), sd = sd(tri$minutes), lower.tail = FALSE) * 100)
[1] 13
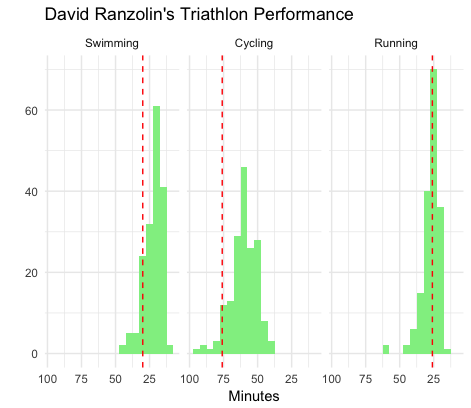
Yeesh. It doesn’t look any better on a histogram or broken down by stage:
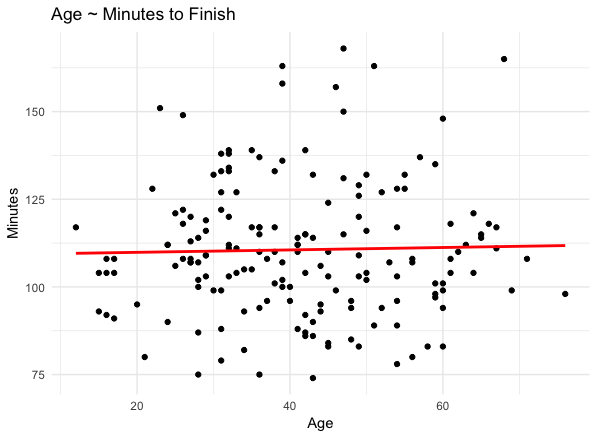
Is there a correlation between age and finish time?
The resounding ‘No!’ was cool to see.
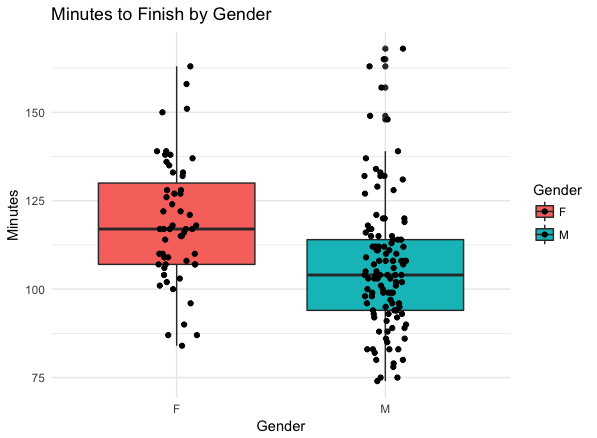
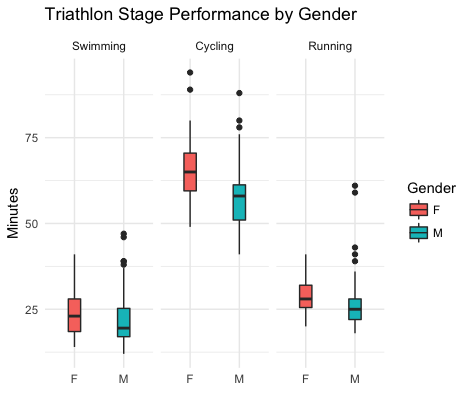
What was the distribution by gender?
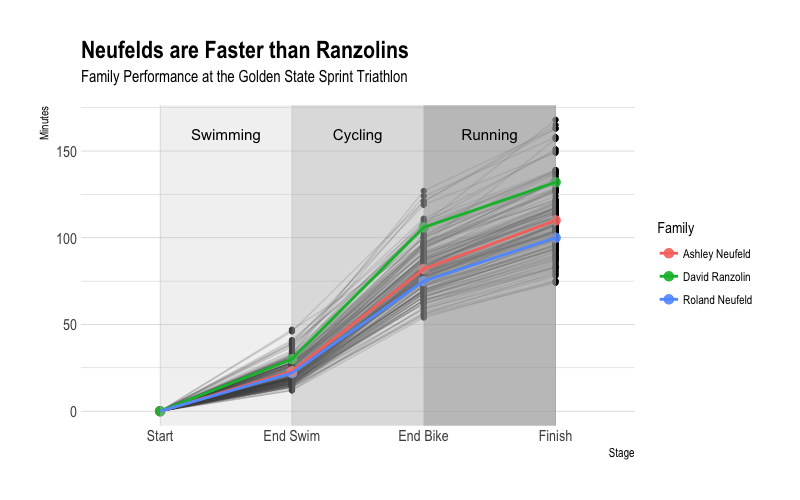
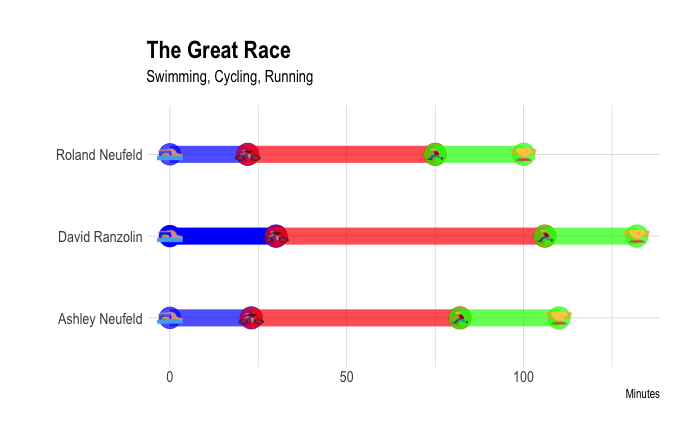
How did the Neufelds, my racing companions, fare?
Better than me.
With emojis!
Some summary statistics:
| gender | mean_minutes_to_finish | sd_minutes | median_minutes | best | average_age |
|---|---|---|---|---|---|
| F | 118.7636 | 17.35892 | 117 | 84 | 37 |
| M | 106.6071 | 18.64382 | 104 | 74 | 43 |
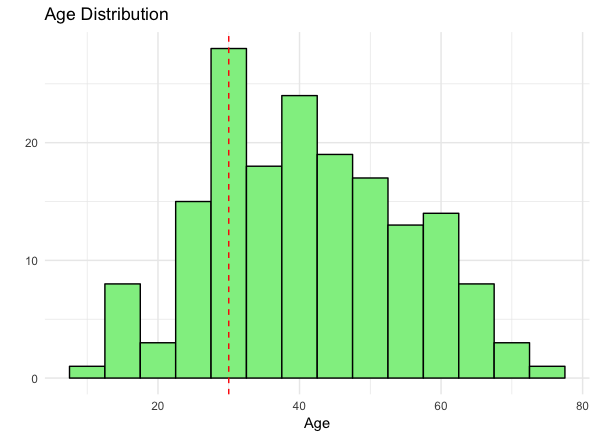
Bonus: Age distribution
-
But not by the guy on a BMX. ↩