Your reporting infrastructure is like a puzzle: you have to know how the pieces fit. Your ETL scripts are a piece; your table schema is a piece; your data extraction tools are a piece; and your output is a piece. While brute force and time can wedge anything together (however...
[Read More]
Biologists tell us our eyes evolved to seize upon movement. This evolutionary quirk, once the difference between death by sabertooth and another night in a cave, is now exploited by marketing professionals, entertainers, and most recently, data analysts. But animation in the data visualization space–while always fun–is sometimes gratuitous. Do...
[Read More]
One of my friends is a terrible liar. The tells are numerous–irregular breathing,
irrepressible grins, and pinkened cheeks. This puts him at a competitive disadvantage while
playing certain table games that require an element of deception.
[Read More]
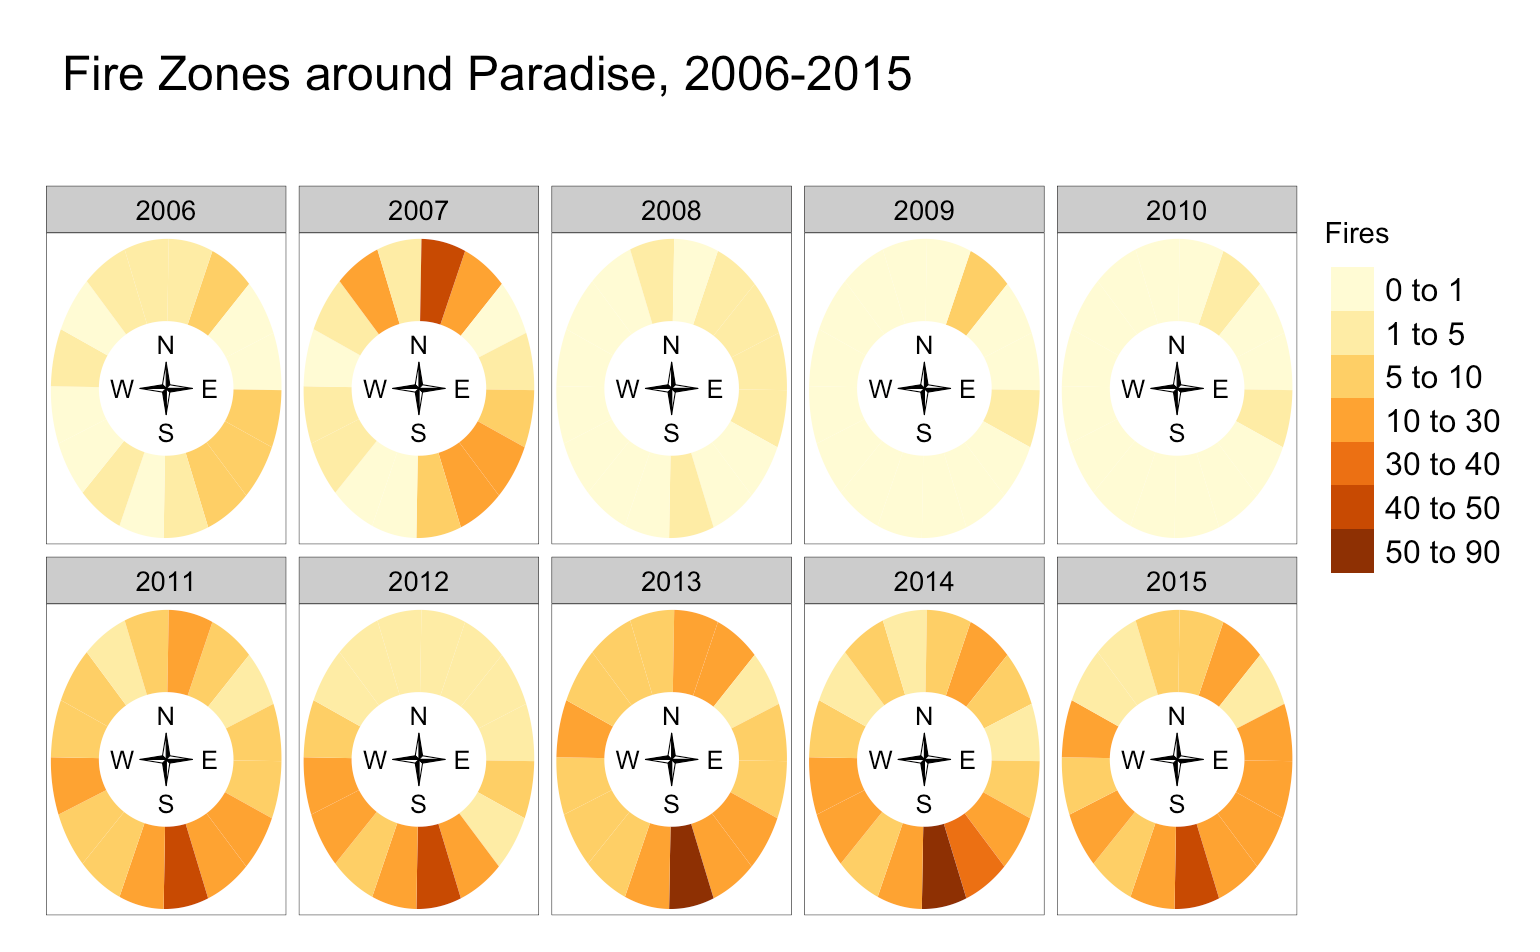
The New York Times recently did an incredible feature on the first 12 hours of the devastating ‘Camp Fire.’ Less than 12 hours after the fire started, they reported, the fire had traveled 17 miles and burned 55000 acres. Can you picture 55000 acres? 17 miles is no problem, but...
[Read More]